
Just Drive:
A mobile app that rewards you for driving well
Sept 2017 - March 2018
Responsibilities: Research & analysis, User testing, Customer journey maps, Competitor analysis, Personas, Gap analysis, Wireframing and Visual / UI design.
Context
Industry
Banking sector, insurance. Working in Agile. Located in South Africa.
Users
Individuals who own and drive vehicles - ranging from new to experienced drivers.
Team
A team of 10, containing designers and business.
Product
Vehicle insurance - a driving app that rewards you for driving well.
Project timeline
The brief
Create a mobile app that tracks driving behaviour. The goal is to inform clients of their behaviour, to assist them in improving their score and reward them for doing so.
Features include
Levels/Tier structures to display a users position (this is individual)
Insights around your driving behaviour and score (what the score is and why)
Frequency, times and distances travelled
Expected rewards for good driving
Redeem coupons through the app
An SOS feature for emergencies
Your position in a league structure
The following sections will unpack some of the work completed for research, requirement gathering, creating personas, information design and wireframing.
Research
During the early stage of the project we conducted user interviews, surveys, a gap analysis and a competitor analysis around vehicle insurance.
This was to understand how people view insurance and what they wanted to gain from it.
It was also a way for us to understand the type of rewards people wanted to receive for their driving improvements.
Summary of findings
(what people wanted)
Comprehensive insurance for all events
Affordable insurance / value for money
Add-on benefits
Rewards for driving well
Understanding why insurance is needed
Clarify what's covered
Easy to claim
Emergency / SOS services
Extra money / cash to use for excess
Roadside assistance
Some of the above elements were worked into the product itself, whilst others can be incorporated into the rewards.
Requirement gathering
Our design brief / requirements were driven by the research findings and market trends.
The user needs were extracted from the research as well as the potential solutions to each problem statement.
Thereafter we prioritised the solutions based on business needs and started working towards a feature list and deadlines.
Personas
Three personas were generated to better understand the customers for Vehicle Insurance, the research contained findings for not only their customers, but rather the larger South African customer base. The persona’s range from a first time vehicle owner all the way to an expert driver.
A lot of research insights were used to formulate the personas and to look at their experiences in terms of:
Why insurance is needed in the first place
To find the right insurance for them
Acquiring the specific insurance
What happens while having insurance (such as claims, rewards etc).
Gap analysis
An industry gap analysis was conducted for Vehicle insurance to specifically understand how each of the three persona’s needs are being met by top competitors.
These solutions were then ranked in terms of successfulness and added to the solutions the team was currently brainstorming. They were further explored with product owners to determine potential implementation in the market.
Information design
The way in which information was structured in the app was driven by best practices, industry standards and some insights from the competitor analysis.
Process for information structure using the home page:
High level breakdown of the information we needed to display.
What type of information is displayed in each section.
Wireframe with more detail showcasing the placement and fidelity of the information.
Final design
Wireframes
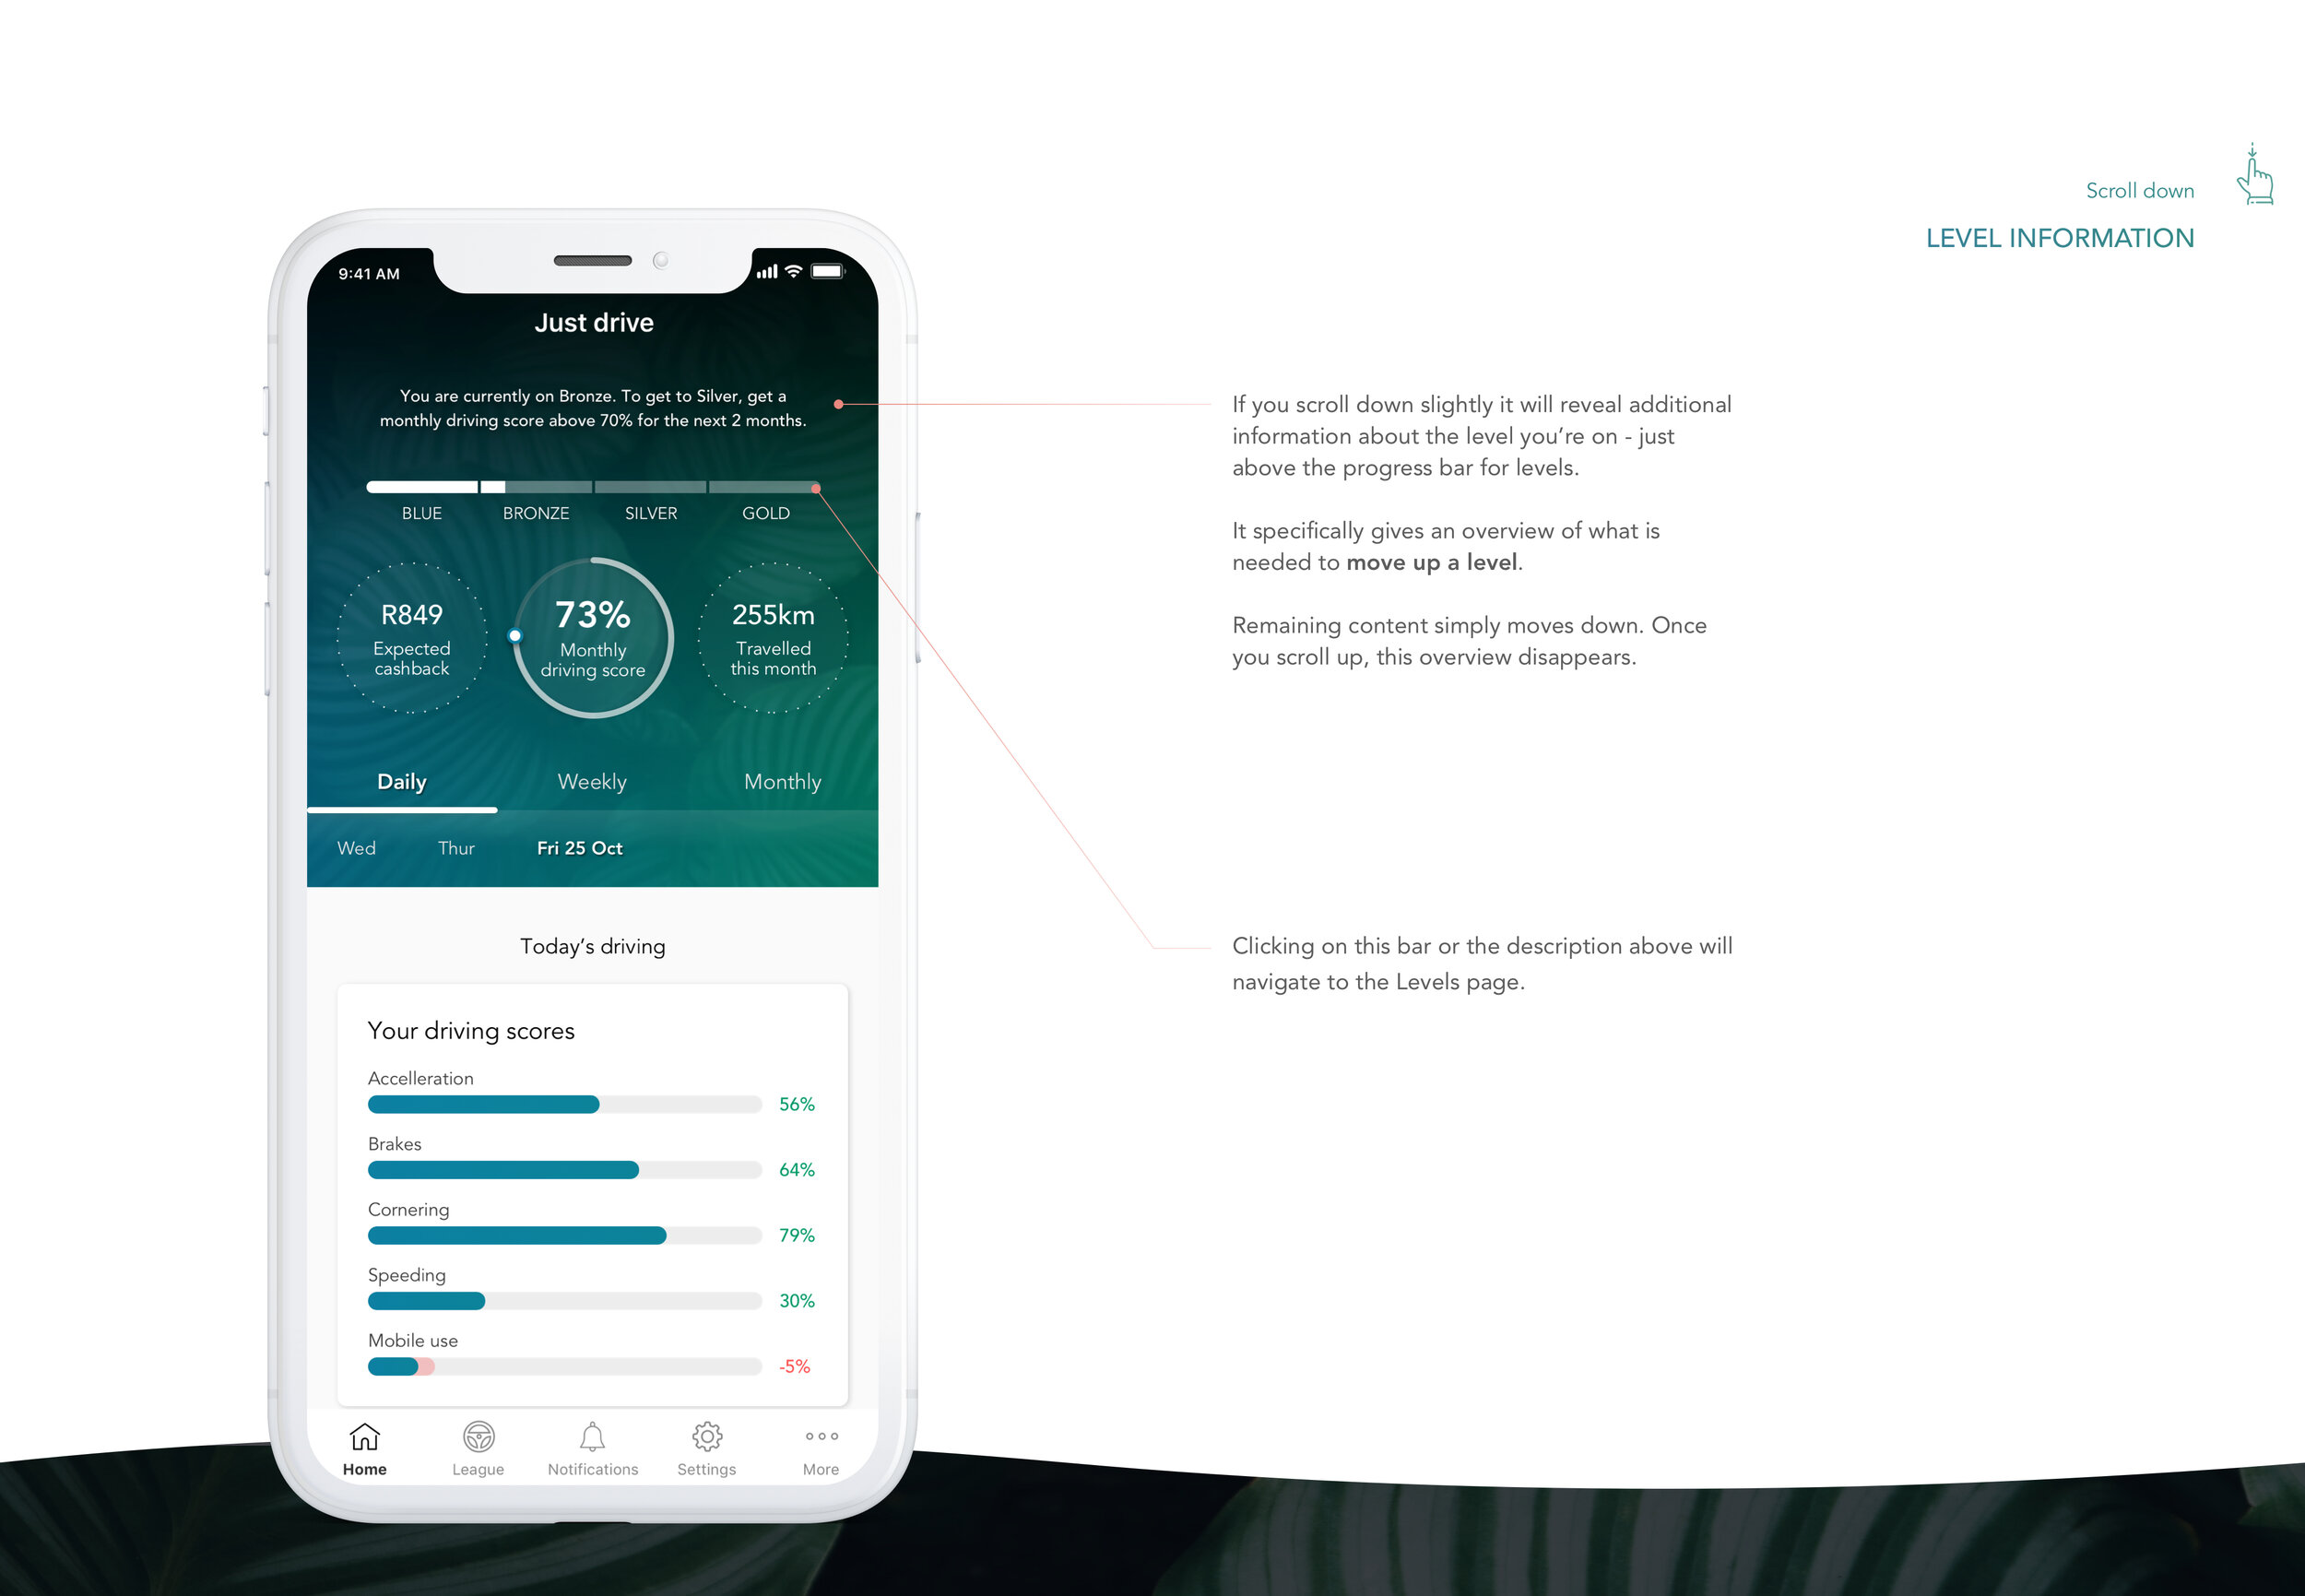
Home page scroll up and down:
Shows scores and trip information
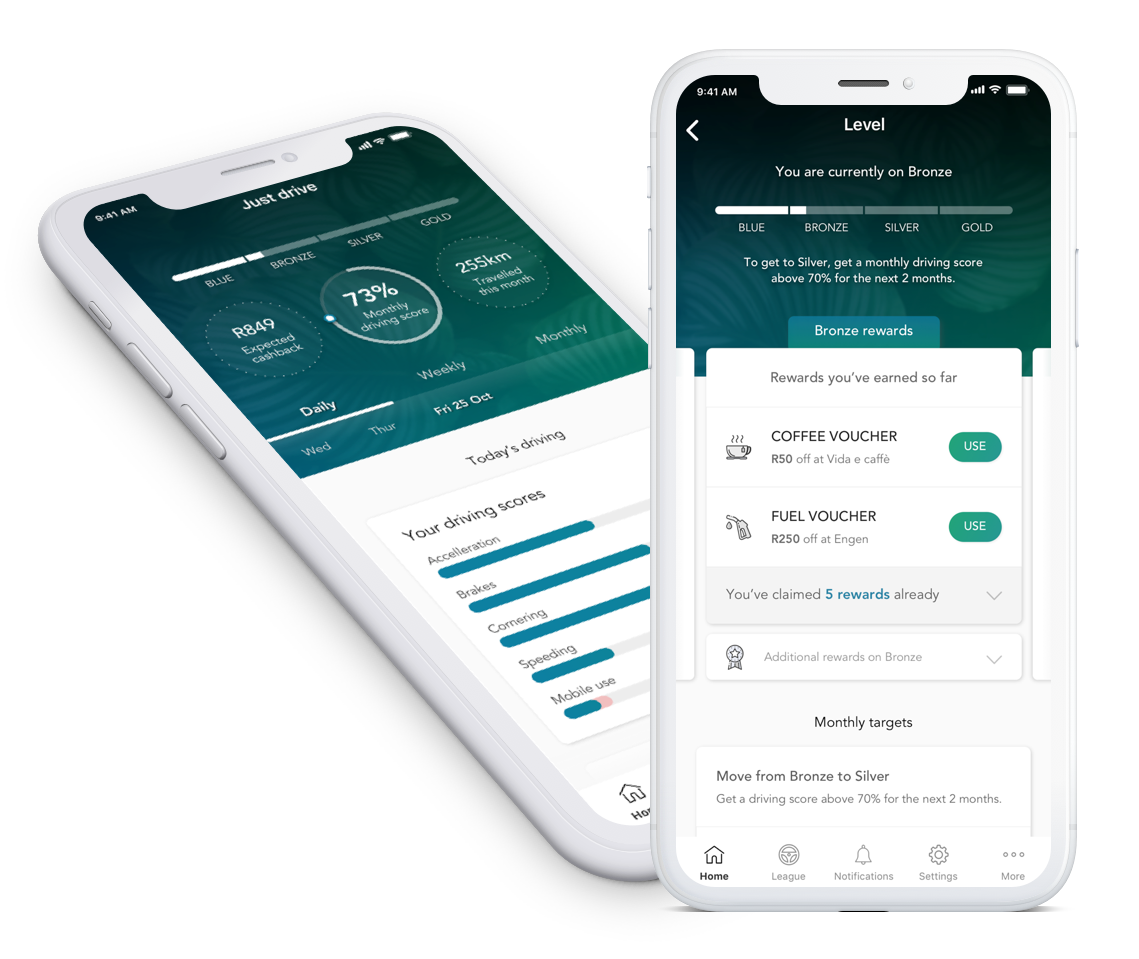
Swipe left and right:
Shows weekly and monthly data
Additional screens for Levels:
Show rewards for all levels, claim reward and monthly targets.